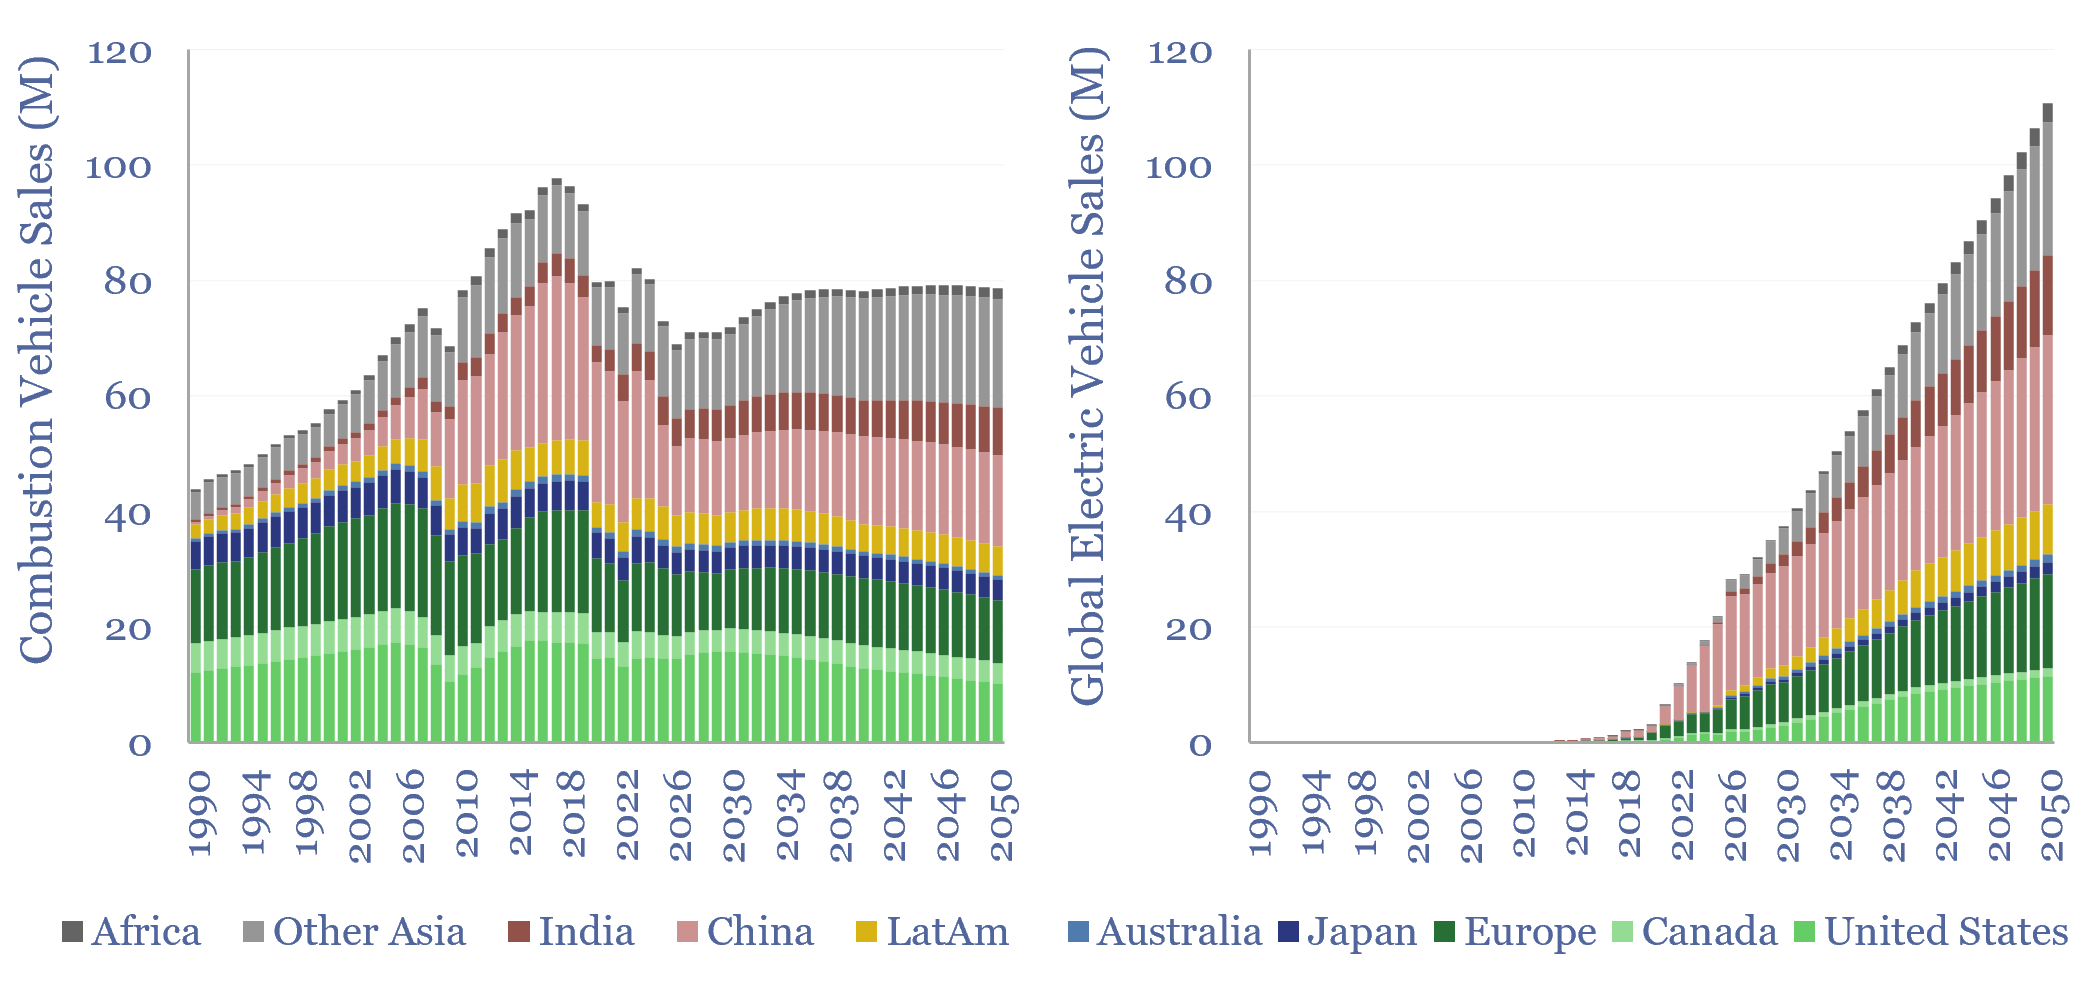
Global electric vehicle sales will ramp from c22M units in 2025 to 110M units in 2050, while combustion vehicle sales flatline at 80M units per year. This data-file forecasts global electric vehicle sales by region, the total electric vehicle fleet, and thus informs our models for long-term global oil demand.
Our long-term forecasts for global oil demand see gasoline and diesel demand from light vehicles falling by 2050, as electric vehicles compete with combustion vehicles. In thermodynamic terms, EVs are a superior technology. But how quickly do they ramp and replace internal combustion incumbents?
This data-file models the global vehicle fleet by region, starting with numbers from the OICA, adding our own estimates going back to 1990 and the running forecasts out to 2050.
The simple mathematical methodology is that the fleet in Year X equals the fleet in Year X-1 plus new vehicle sales minus retirements.
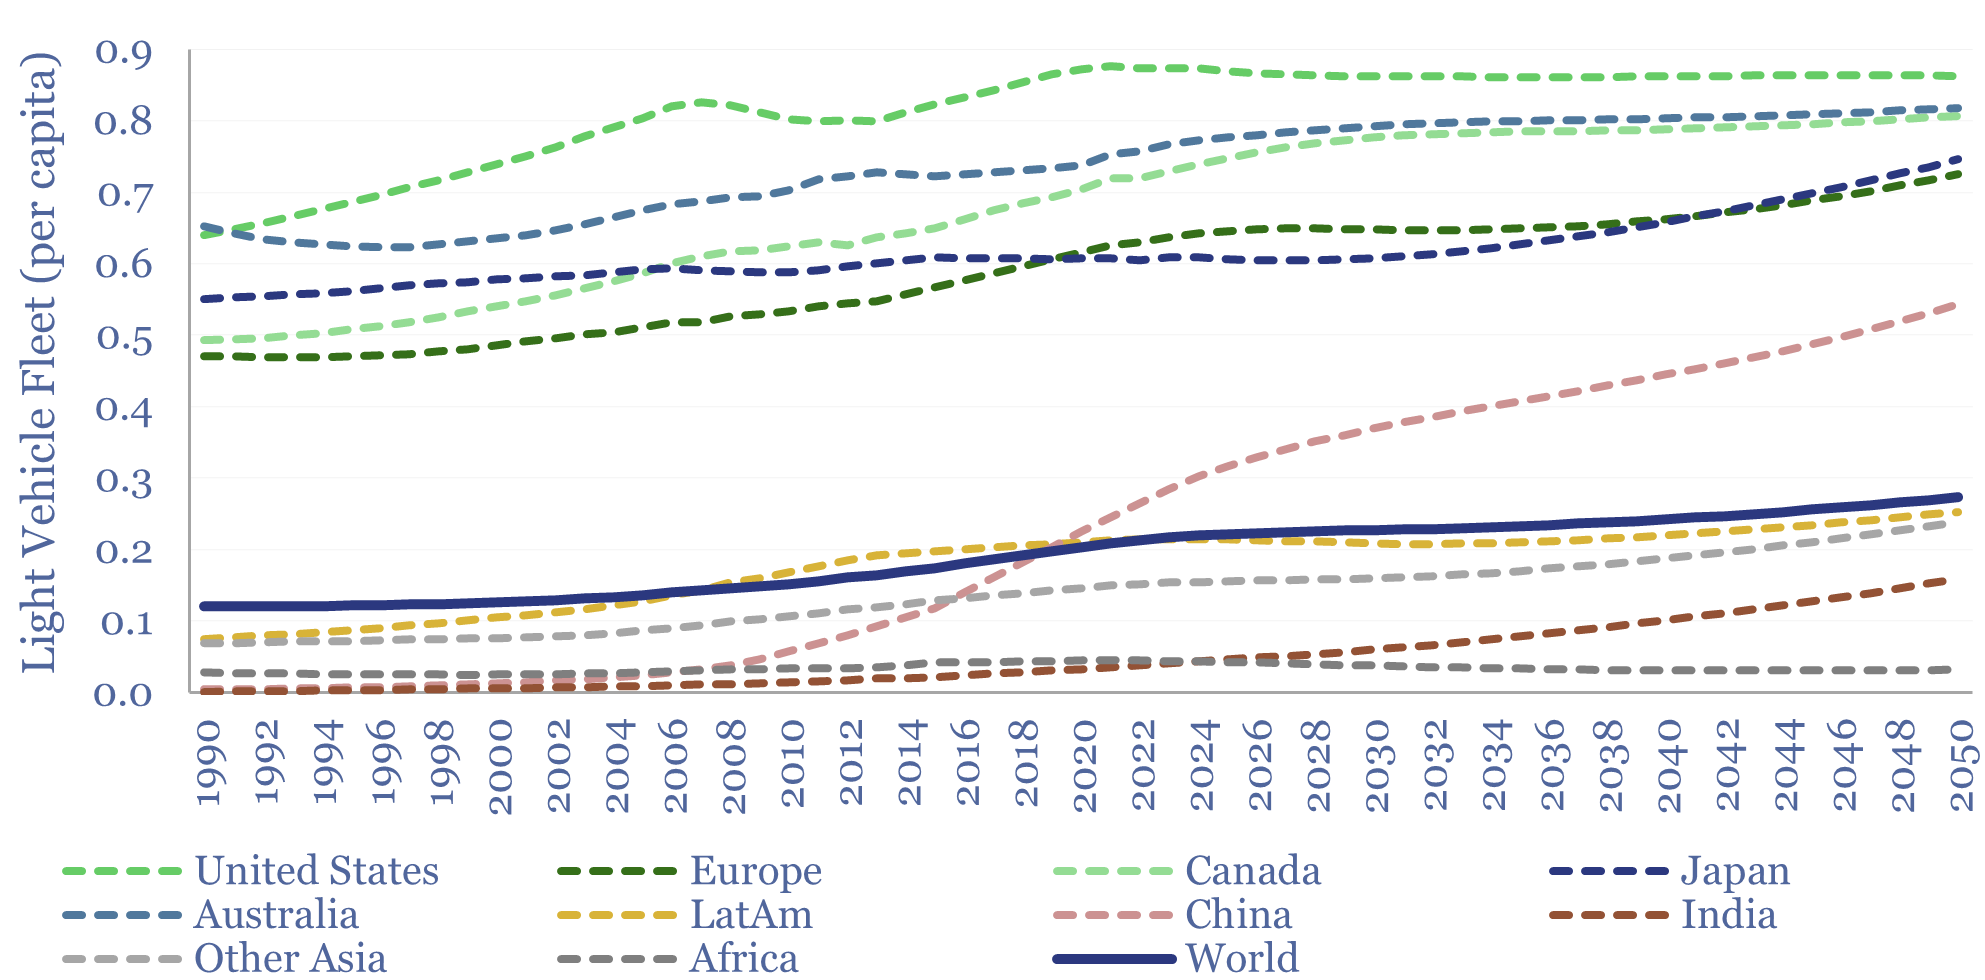
Today’s global vehicle fleet consists of 1.8bn light vehicles, of which 290M are in the US, 335M in Europe, 73M in Japan, 430M in China, 60M in India, 65M in Africa. This includes passenger vehicles and light commercial vehicles.
Global vehicle sales will rise by almost 2x, from c95M units in 2024 to 190M in 2050. In per capita terms, this is an increase from 0.012 sales pp pa to 0.02 pp pa by 2050, mainly driven by GDP per capita rising from $13k pp pa to $22k pp pa, and especially in the emerging world.
Global vehicle ownership would thus increase c50%, from 0.2 pp to 0.3 pp. Vehicle ownership rates move sideways in the developed world; but rise in the emerging world. By 2050, car ownership rates are “only” 25% below today’s developed world levels in China, 50% below in other Asia, 60% below in LatAm, 75% below in India and 85% below in Africa.
An increasing portion of global vehicle sales are electric as part of our roadmap to net zero. We previously entertained a base case scenario where effectively all vehicle electrified. However, over time, a more even mix by 2050 has started to seem more likely.
We updated our electric vehicle sales forecasts in 2024, revising our 2025-30 forecasts downwards by 20-25%, for reasons linked to mass-market affordability, income and attitudes. The logic and reasoning are described on the welcome tab of the model.
We updated our numbers again in July-2025 and December-2025, after assessing that the total system costs of solar-powered EVs would be around 12% lower than oil-fueled ICEs by 2030, which is enough to propel EV adoption, especially in the emerging world, but not likely enough for a wholesale shift towards EVs.
We then updated our numbers again in April-2026, revising 2026 and 2027 forecasts higher, after the oil price volatility and disruption associated with conflict in the Middle East.
Electric vehicle sales are forecast by region in the data-file. But the numbers can be varied in the data-file, to stress-test your own scenarios. This also drives the demand for key materials used in batteries, motors and traction inverters, such as lithium, fluorinated polymers, battery-grade nickel, graphite, copper, Rare Earth Metals and SiC.
Retirement rates of vehicles depend on their age and location. Further data on the typical retirement ages of vehicles is tabulated here. But in the model, we have had to an acceleration in old vehicle retirement rates, to phase out ICEs faster. This remains debatable!
Please download the data-file to stress test the evolution of global vehicle sales and the global vehicle fleet.